


Volatility smile and smirk
Markets showing us how they disagree with models


Exploring the Black-Scholes Model and Volatility Dynamics
The Black-Scholes model asserts that for a fixed underlying asset, returns will follow a Brownian motion. This effectively means that prices evolve as a geometric Brownian motion, leading to the conclusion that prices will be log-normally distributed at any fixed point in the future.
The Elegance and Limitations of Black-Scholes
While the model is elegant—largely relying on the Central Limit Theorem and a no-arbitrage assumption—it is also overly simplistic. Its assumptions often do not hold true in real markets, which have their own unique ways of signalling discrepancies.
The Role of Volatility
In the Black-Scholes Model (BSM), volatility (σ) is the sole unobservable variable. In this framework, the price of options increases monotonically with σ. However, even with a fixed underlying asset and expiration date, different strike prices yield varying implied volatilities. This divergence indicates that the market frequently disagrees with the Black-Scholes model
Understanding the Volatility Smile/Smirk
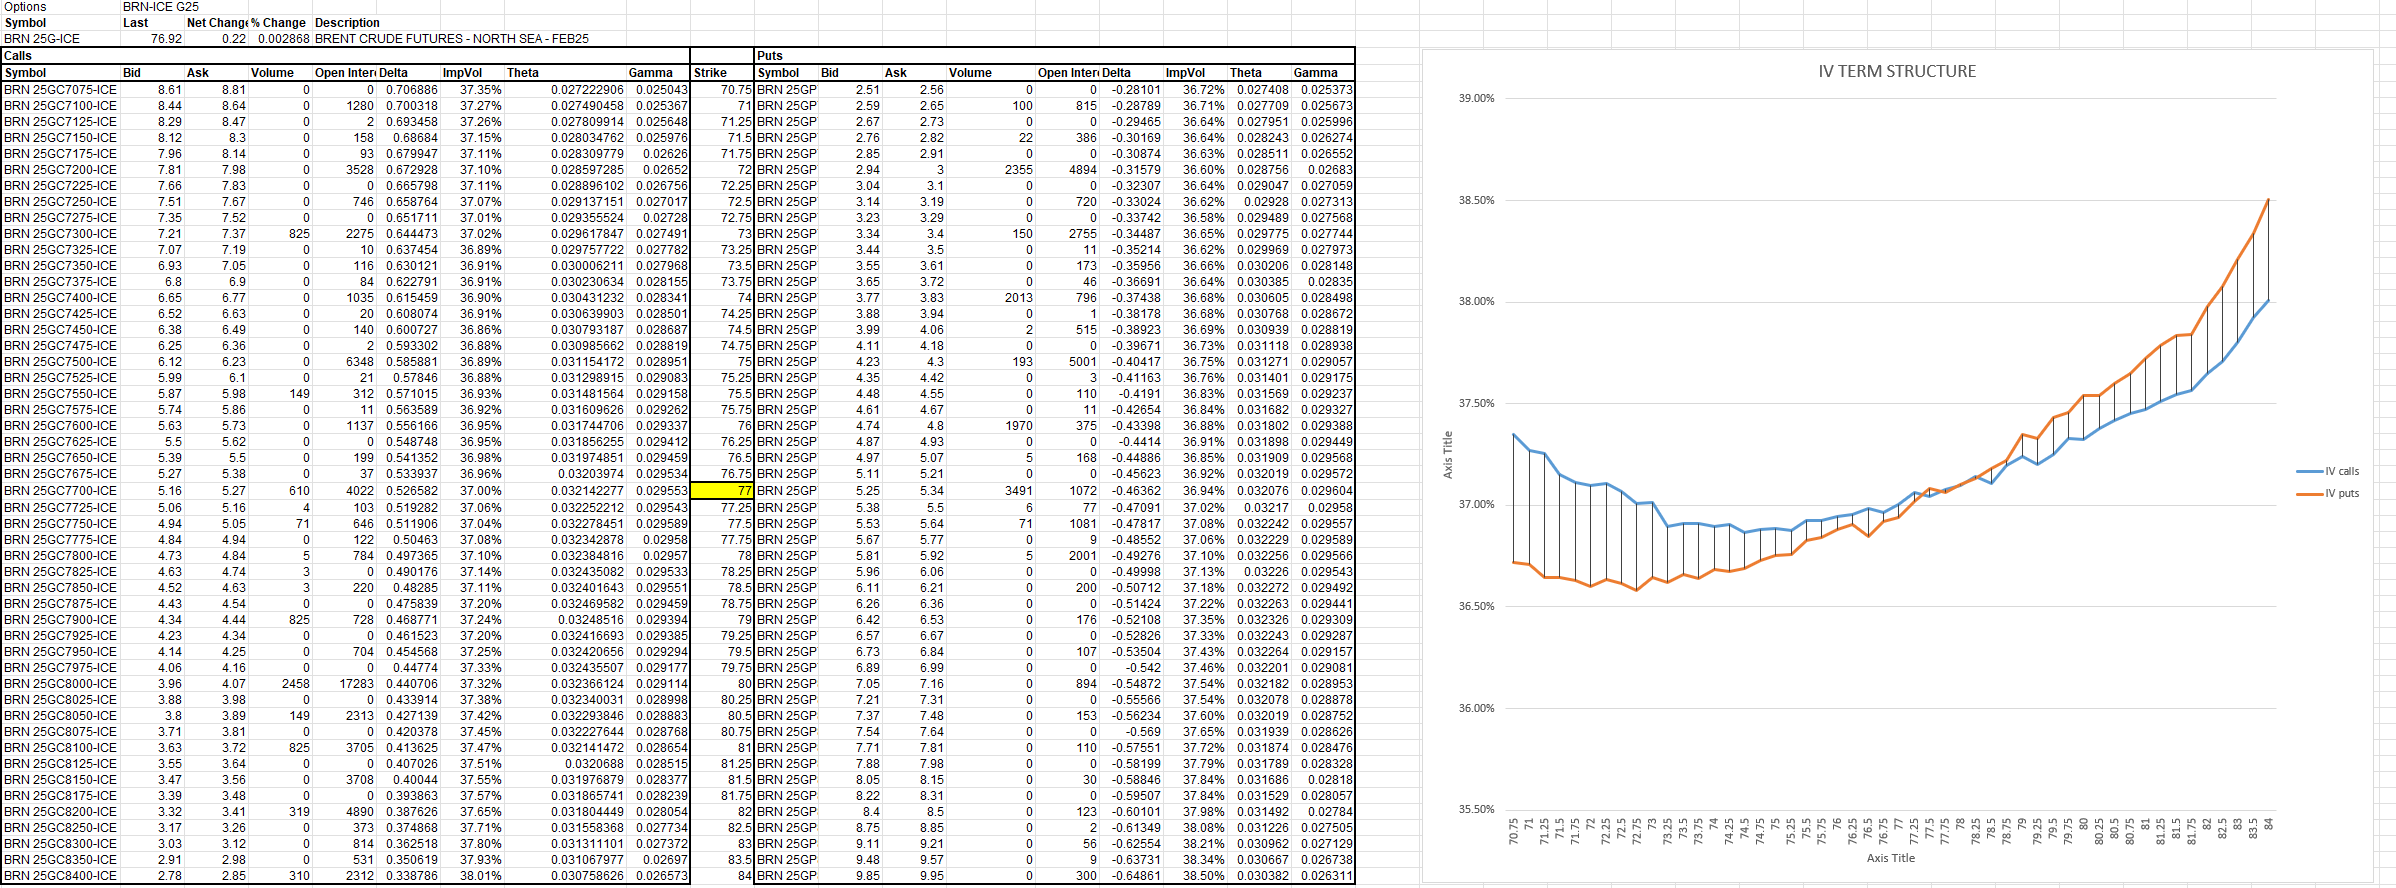
This phenomenon is known as the implied volatility (IV) smile or smirk. For example, recent data on Brent options revealed that calls were priced higher than puts, suggesting that the market was pricing in more risk for upward movements.
Generally, implied volatility tends to be higher for options further from the spot price (Out-of-the-Money > At-the-Money).
This implies that the market anticipates larger price movements with a higher probability than what pure Black-Scholes would suggest.
Market Signals and Trusting Data Over Models
The volatility smile serves as a cautionary signal against relying solely on the Black-Scholes model. Implied volatility may increase more rapidly when moving away from the spot price, particularly for options below it, which often exhibit higher IV. The no-arbitrage principle posits that the mean future price should align with the current price adjusted by the risk-free rate. However, if skewness indicates a greater likelihood of extreme moves in one direction, it also suggests an increased chance of smaller moves in the opposite direction.
Conclusion: Prioritizing Market Insights
The Black-Scholes model remains foundational in finance but is often challenged by volatility smiles and skews that illustrate market sentiment diverging from theoretical predictions. When skew indicates potential large directional moves, it also hints at smaller moves in the opposite direction. In many cases, trusting market signals may yield better insights than relying solely on models. For those looking to dive deeper into this topic, I highly recommend “The Volatility Smile” by Emanuel Derman and Michael B. Miller. This complex subject deserves more than just a single article to explore thoroughly.
Variations Across Securities
Different types of securities—such as equities, foreign exchange rates, and bonds—exhibit unique shapes in their volatility smiles. These variations provide crucial insights into how actual market behavior diverges from our idealized geometric Brownian motion with constant volatility. Recognizing these differences is essential for accurately valuing options in real-world markets.
Understanding Momentum in Trading
In physics, momentum refers to both the quantity and direction of an object's motion. Since physical momentum is conserved, an object in motion tends to remain in motion. In trading, momentum describes acceleration when an underlying asset begins to move rapidly. The Efficient Market Hypothesis (EMH)posits that this rapid movement does not have a specific direction; a fast-moving underlying can just as easily reverse direction as continue its trajectory. Our physical intuition can often mislead us.
The Volatility Smirk Explained
Volatility reflects the instantaneous instability of prices but is not directly observable. The implied volatility of an option represents what volatility would need to be constant from now until expiration for the option price to be fair. Because IV varies across different options for the same underlying asset, graphing IVs against strike prices can provide valuable insights. Typically, Out-of-the-Money options have higher IVs, resulting in a graph resembling a volatility smile. Referring to it as a volatility smirk emphasizes its common asymmetry; usually, the lowest IV occurs slightly above the spot price.
Approximating Local Volatility
The local volatility model is a minimally assumptive dynamic volatility model derived from treating option prices at each strike and expiration as correct—essentially trusting EMH. This results in a deterministic model that predicts how volatility will respond to random price fluctuations based on the entire option chain. While calculations using local volatility can be complex, they generally align with the shape of the volatility smirk. Although momentum may seem evident in price action, aligning momentum with physical intuition contradicts EMH principles. The compounding effects of sudden large moves are better understood as outcomes of increasing volatility, making both significant movements and reversals more likely. By closely observing the shape of the volatility smirk—especially identifying strikes with minimal IV—you can form reasonable expectations about how volatility will react to changes in spot prices.